Windstream IP Network Statistics Guide
This guide provides information on how to access and use Windstream IP Network Statistics. This data is publicly available on the internet and no login is required.
The Windstream IP Network Statistics provides metric data for each of the Windstream's backbone POPs.
Metric Data Terminology
- Network Latency
- Latency in a network is measured as either the one-way(from source to destination) or round-trip(from source to destination + destination to source) delay time usually measured in milliseconds(ms).
- Network Jitter
- Jitter in a network is the time variation between when a packet is transmitted and when it's received.
- Packet Loss
- Network Packet Loss is the percentage of packets that were transmitted but not received by the destination with respect to the total number of packets sent.
- Network Availability
- Network Availability is just the inverse of the packet loss. It is the percentage of packets transmitted and successfully received with respect to the total number of packets sent.
Network Latency Grid
The Network Latency Grid page displays a grid of the latest one-way latency values between two markets. The source markets are the labels on the left side and the destinations are labeled across the top. See image below.
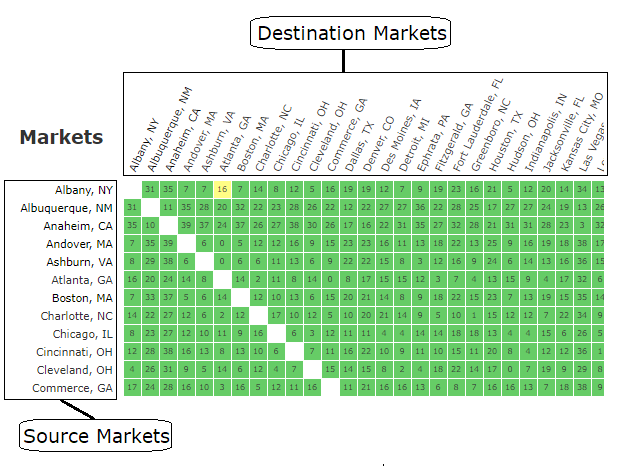
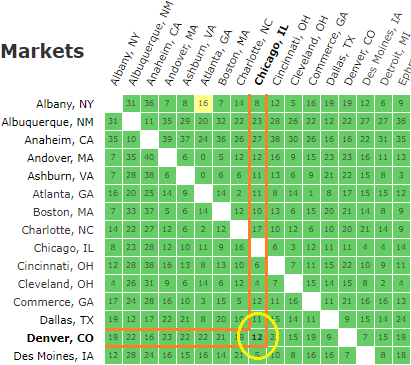
The individual boxes of the grid contain the one-way latency value between the source and destination market. For example, the latency between Denver and Chicago is 12ms in the example below.
When you hover your mouse over any of the grid boxes, it will show a popup with additional metrics. You can also click on a grid box to show 7 days of historical data.
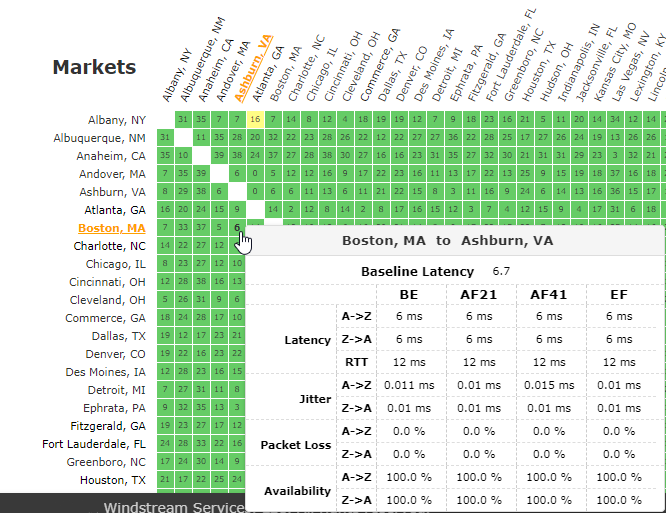
The QoS queues are defined below:
Network Latency Historical Data
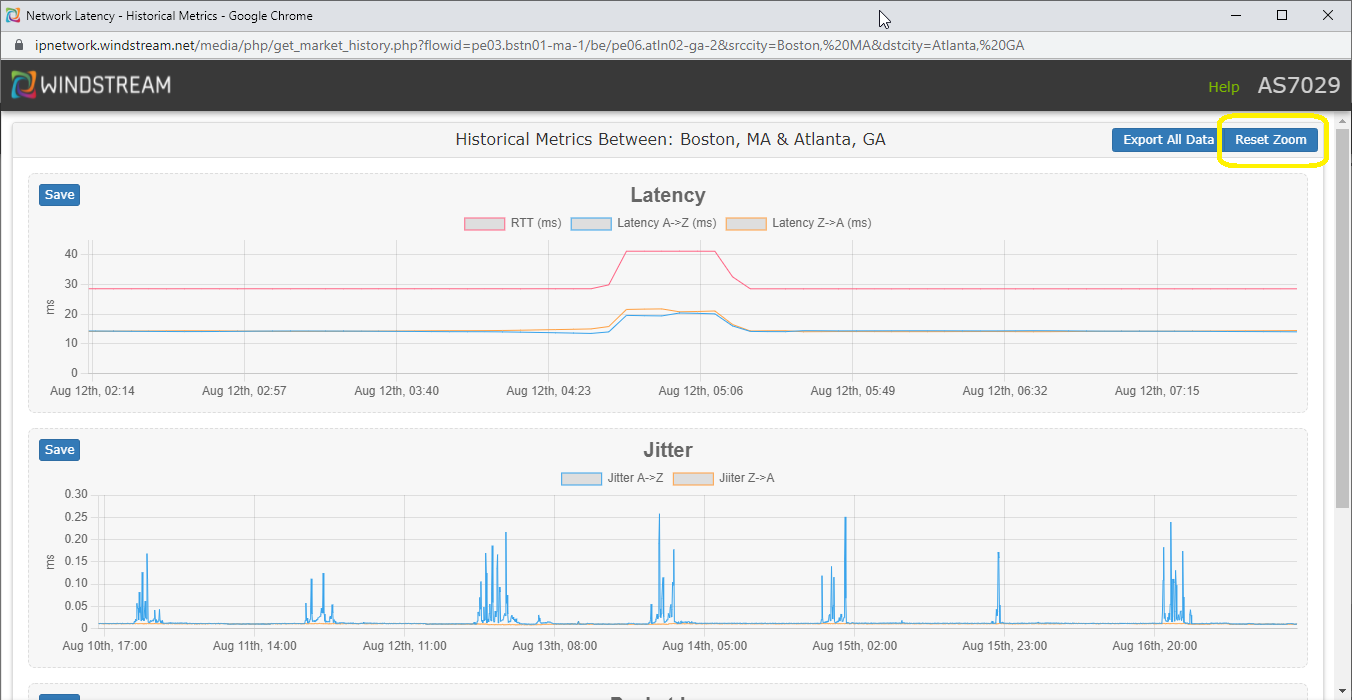
The Network Latency Historical Data popup displays 7 days of historical data for the latency, jitter, and packet loss metrics. (to display, click on any of the grid boxes on the latency grid)
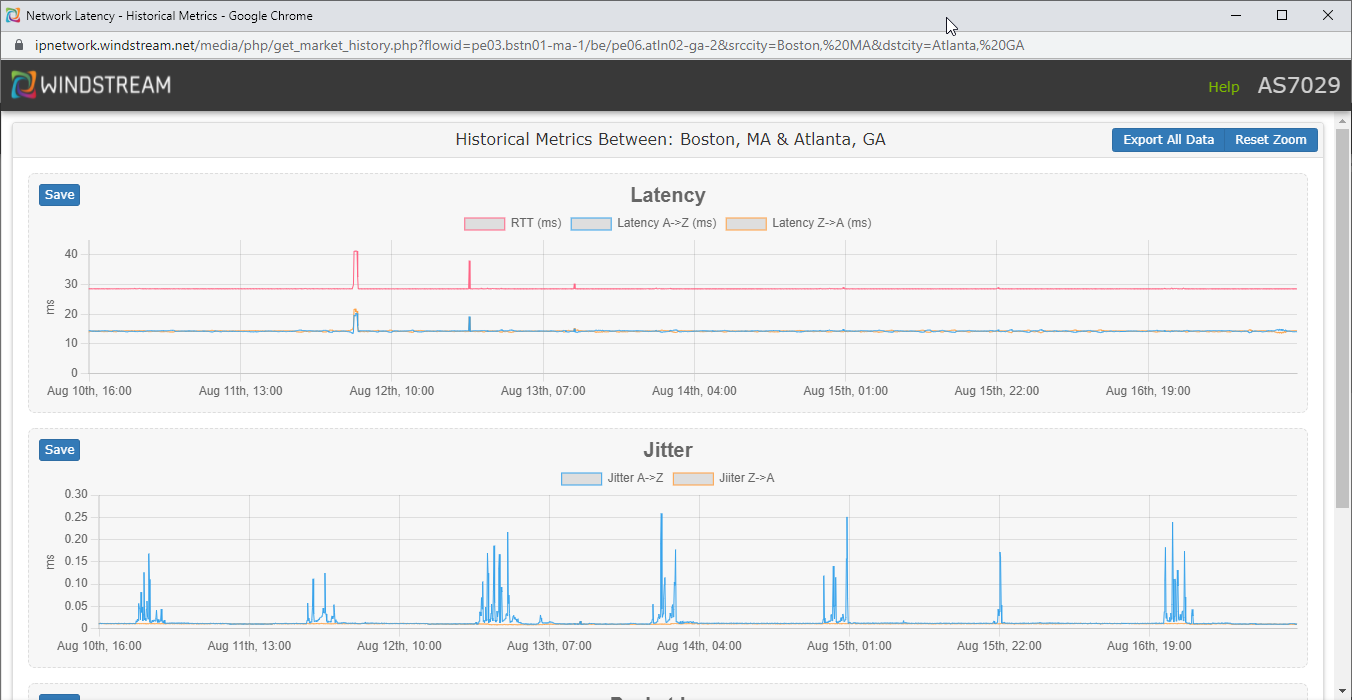
You can zoom in on the line charts by clicking and dragging on a chart.
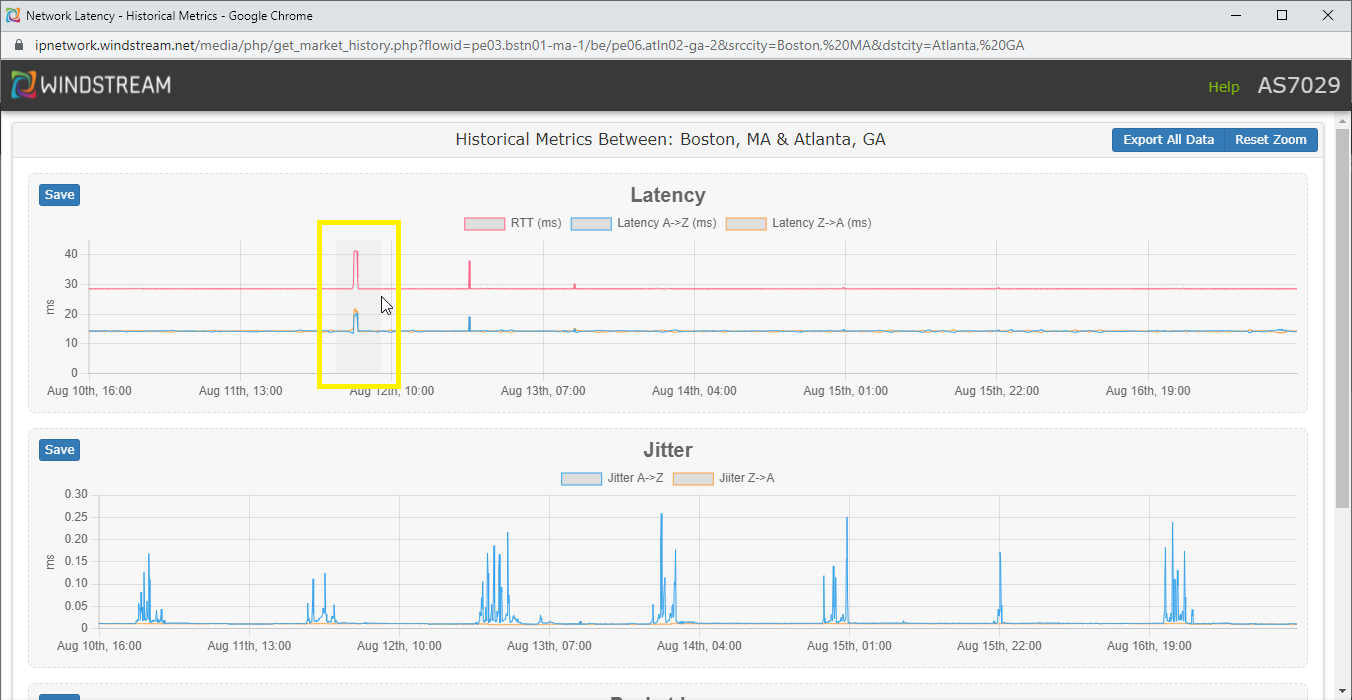
To reset the zoom & show all of the data, click the "Reset Zoom" button in the top right corner.
